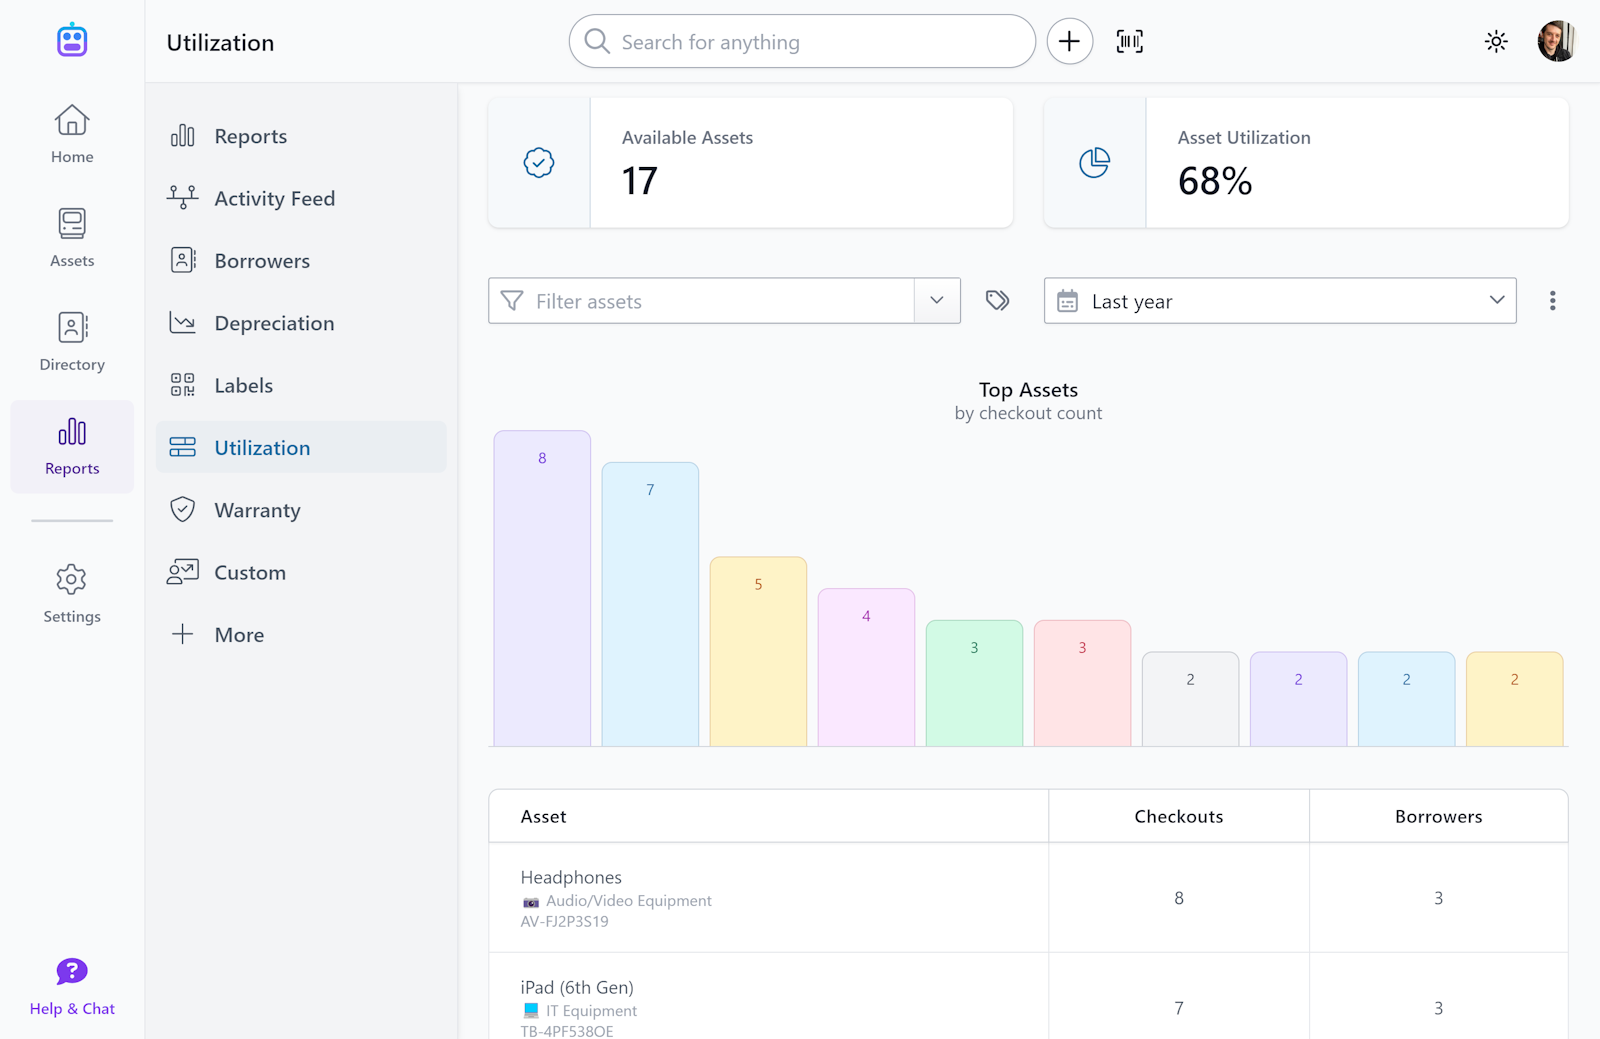
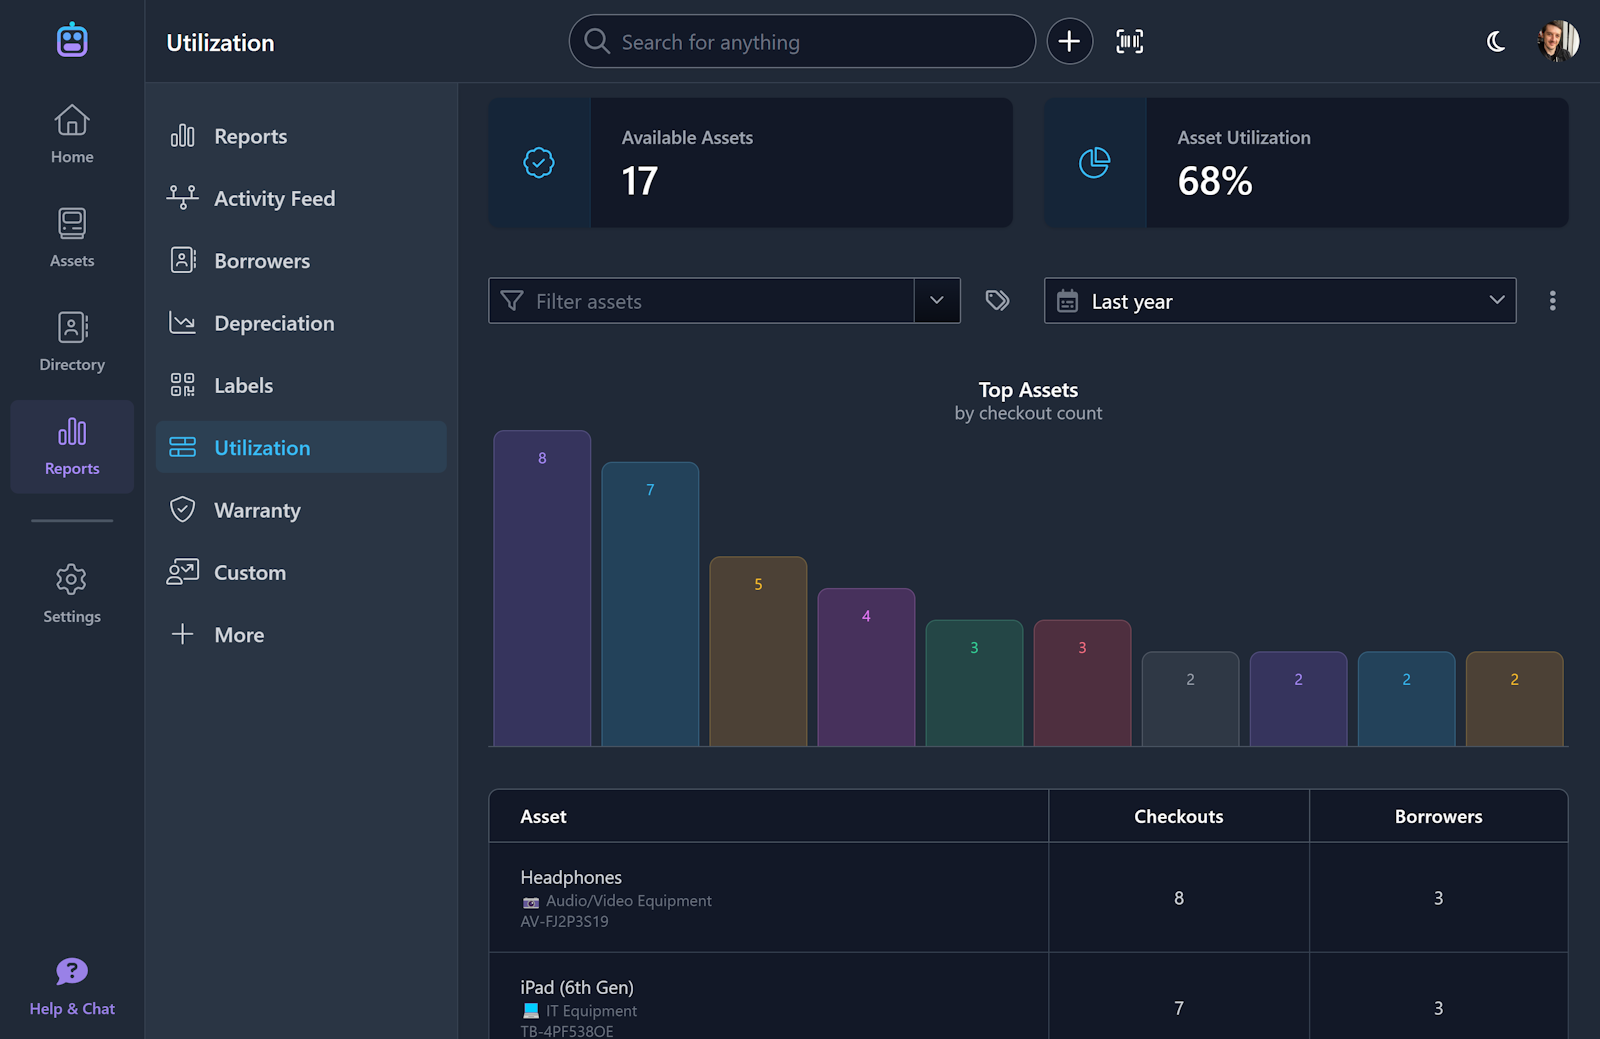
Utilization Report
New Feature
Have you ever wanted to know which assets are your most frequently used? Our new Utilization report lets you explore your assets by how many times they’ve been checked out. Even better, the report fully time travels: you can see which were your top assets last month, last quarter or last year, as well as what your relative utilization was over that time.

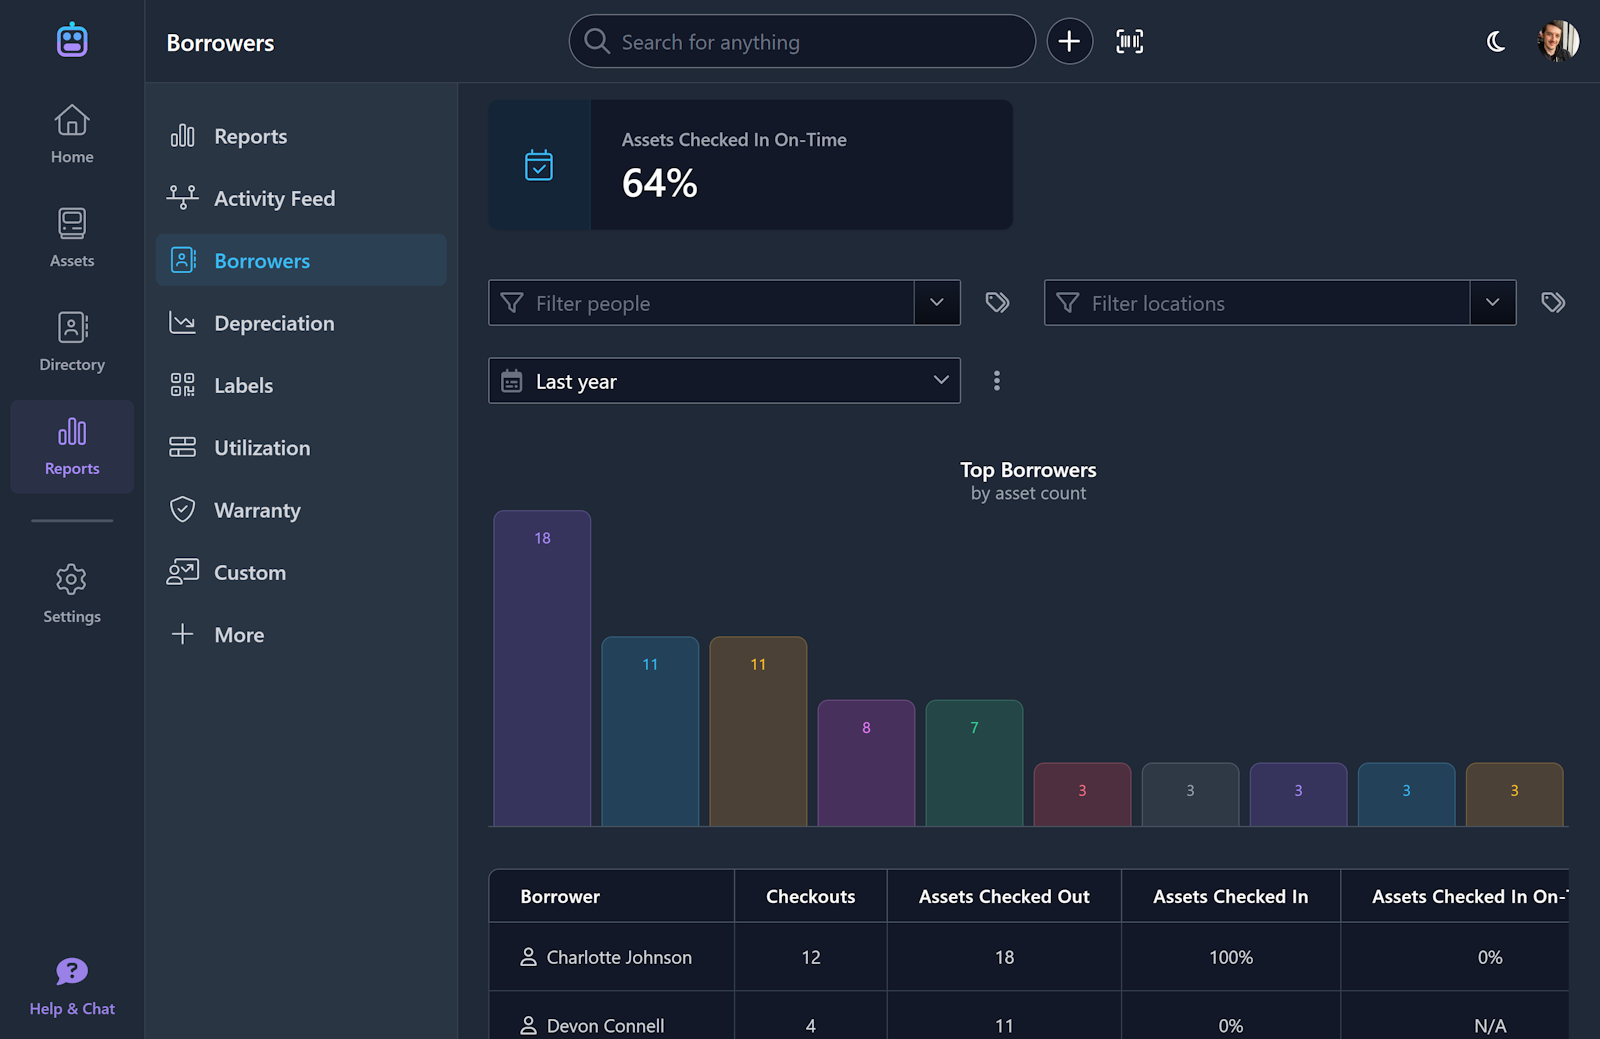
While building this report we also added time travelling to our Borrowers report, which shows you your top borrowers over time.

Both reports offer instant exploration of your asset utilization as well as the ability to export data to an Excel or CSV file for further analysis.

